
The S&P 500 is up 14% as of August 24th—a good year by historical standards. That said, the market is off 4.6% since the end of July. And earlier this year the market was down 7.5% from its prior peak in early February.
Attempts to narrate the recent pullback have spanned from interest rates to earnings results to China’s “Lehman moment.” The latter being a reference to the US Financial Crisis, which started with the unexpected collapse of major financial institutions. How a real estate crisis known to the market for over two years could be a “Lehman moment” of the sort feared remains a mystery to me.
One recent quote from the Wall Street Journal stated, “Investors said the pullback by consumers could have repercussions far beyond the retailers’ results.” The referenced retailers were Dick’s Sporting Goods and Macy’s, both of which have struggled to adapt to a changing retail environment.
The article went on to quote a portfolio manager, who opined, “As consumers’ dollars don’t go as far and they buy lower volumes of things, the whole economy slows down.” While it’s true US GDP is heavily biased to consumer spending, consumer sentiment is up 20.3% the last three months. Further, US personal consumption (PCE) on goods is up 3.7% YTD while spending on services is up 3.6%. PCE inflation ended at 2.6% over that period, implying that consumer spending isn’t just empty inflation dollars.

In March 2009, during the worst of that year’s drawdown, one headline read “Brutal February for Blue Chips.” Another was titled, “Value Investors Can’t Beat This Bear.” The latter article started by declaring, “The risk of buying cheap stocks is that they can just keep getting cheaper.” The market was up 52% from the time those words were published through the end of the year and 23% overall.
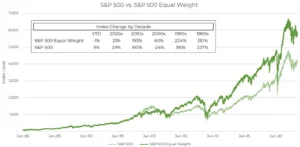
I didn’t read newspapers from every market pullback but I suspect the tone would be similar for each. The point is this: there’s always risks around the corner and it’s part of our wiring as humans to focus on what could go wrong to the exclusion of everything else. But the same instincts that kept our ancestors alive likely isn’t conducive to investing successfully unless we can understand and harness it. To that end, consider the following chart:

Pick any year in the last 72 and there’s been an average drawdown of 15.8% within the prior 12 months. In other words, if you selected the “random button” on your time machine and landed on a day sometime between yesterday and January 1, 1950, you might expect to open a newspaper and read about a 15.8% stock market pullback within the last 12 months. Yet the average return in any of the years in which you may have landed was 9.2% with 73% of them being positive. The upshot: the market goes up more than it goes down but not without significant pullbacks, even in the good years. Let us all remember this when baser instincts come knocking at our doors.
Note: Dividends are excluded from all return references.
Sources. YCharts; “A Wealth of Common Sense”; Wall Street Journal
JGP Wealth Management is a registered investment adviser. This brochure is solely for informational purposes. Past performance is no guarantee of future returns. Investing involves risk and possible loss of principal capital. No advice may be rendered by JGP Wealth Management unless a client service agreement is in place.
This commentary reflects the personal opinions, viewpoints and analyses of the JGP Wealth Management employees providing such comments, and should not be regarded as a description of advisory services provided by JGP Wealth Management or performance returns of any JGP Wealth Management client. The views reflected in the commentary are subject to change at any time without notice. Nothing in this commentary constitutes investment advice, performance data or any recommendation that any particular security, portfolio of securities, transaction or investment strategy is suitable for any specific person. Any mention of a particular security and related performance data is not a recommendation to buy or sell that security. JGP Wealth Management manages its clients’ accounts using a variety of investment techniques and strategies, which are not necessarily discussed in the commentary. Investments in securities involve the risk of loss. Past performance is no guarantee of future results.